Abstract
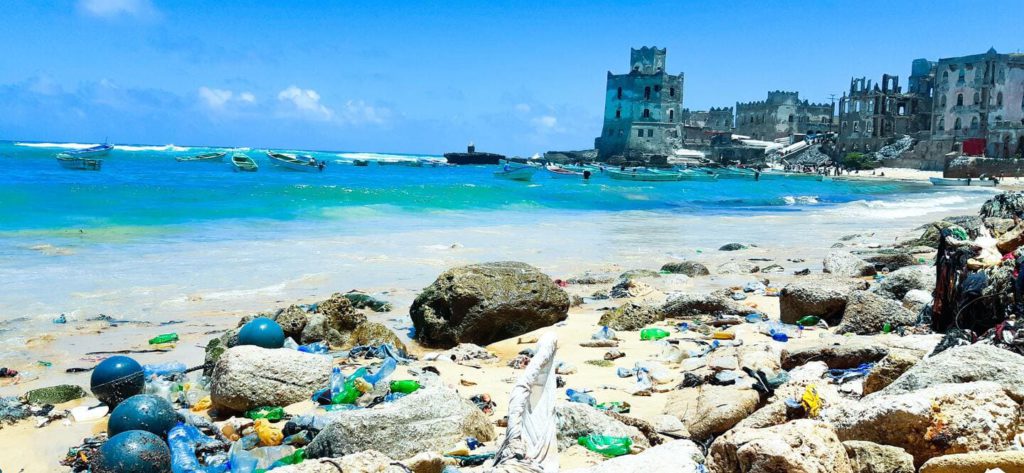
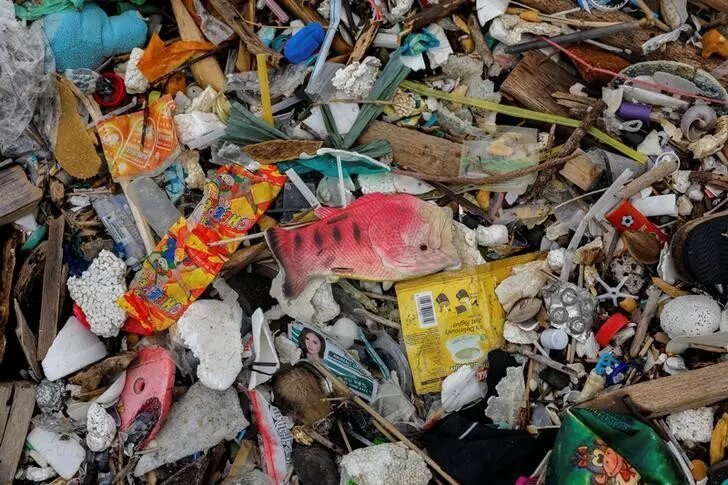
Concern over plastic pollution of the marine environment is severe. The mass-imbalance between the plastic litter supplied to and observed in the ocean currently suggests a missing sink. However, here we show that the ocean interior conceals high loads of small-sized plastic debris which can balance and even exceed the estimated plastic inputs into the ocean since 1950. The combined mass of just the three most-littered plastics (polyethylene, polypropylene, and polystyrene) of 32–651 µm size-class suspended in the top 200 m of the Atlantic Ocean is 11.6–21.1 Million Tonnes. Considering that plastics of other sizes and polymer types will be found in the deeper ocean and in the sediments, our results indicate that both inputs and stocks of ocean plastics are much higher than determined previously. It is thus critical to assess these terms across all size categories and polymer groups to determine the fate and danger of plastic contamination.
Introduction
Marine microplastics (10–1000 µm) belong to the continuum of the discarded plastic debris that enters the ocean from land-based and marine sources1. The pathways of plastic input are very diverse and include riverine2 and atmospheric transport3 from coastal and inland areas, illegal dumping activities, erosion of legacy refuse dumps, and direct at-sea littering from shipping, fishing and aquaculture activities1,4. The ubiquitous presence of microplastics in the marine environment raises concerns over damage they could cause to oceanic ecosystems and eventually to human health5,6. Yet, the scientific evidence for the present and future risks from microplastics is far from robust as sources, exposure levels and harm from these contaminants are all poorly constrained. Although a significant body of data on (micro)-plastic loads in the ocean has been collected, the geographical spread of the measurements is sparse and have been mostly focussed on plastic particles greater than 250 µm in size from the surface waters and seafloor (ref. 7 and references therein). Abundance and distribution of microplastics, especially those in smaller size categories (<250 µm) throughout the vast ocean interior remain virtually unknown except for one full-depth (8–4400 m) survey in the Arctic Central Basin8. This leaves a significant knowledge gap, as the presence of microplastics >11 µm in the deep-sea sediment9 indicate that removal from the surface ocean to the abyss does take place. Given the current lack of knowledge about the location and fate of microplastics in most of the ocean volume, the loads of oceanic plastics floating in the surface ocean cannot be balanced by their mass fluxes from land and marine sources7,10. The estimated inputs of plastic debris into the ocean2,4,11, in turn, are also massively uncertain and require robust empirical assessments on a global scale.
The additional challenge/uncertainty comes from the versatility of plastic materials and hence the necessity to assess the pollution with classes/polymer types of microplastics rather than considering them as a single material2. The extremely wide range of physical and chemical properties of different plastic types would in part determine the extent and rate of their transformations (e.g. fragmentation12,13, degradation14, aggregation15) and interactions (biofouling16 and ingestion17,18) in the ocean and thus their persistence and impacts on the biota therein.
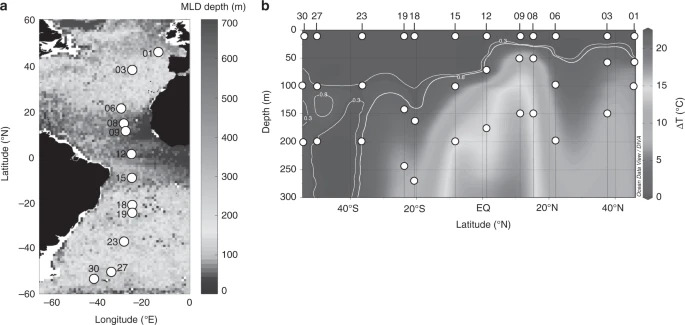
Here, we assessed the pollution from polyethylene (PE), polypropylene (PP) and polystyrene (PS) litter at 12 locations on a 10,000 km North–South transect of the Atlantic Ocean (Fig. 1). The polymer groups investigated are the most common commodity plastics that are mainly used for packaging. They thus have a short lifetime and a high contribution to the content of the global plastic waste (56%)19. Recent meta-analysis20 also identified PE, PP and PS as the most abundant polymers in the marine environment, although their distribution in the open ocean and especially its interior was poorly constrained. We measured penetration of PE, PP and PS particles down to 25 µm in size from the near surface to the ocean interior below the maximum depth of upper ocean mixing (>200 m). We discuss our findings in the context of previous observations and estimates of plastic pollution in the Atlantic, both horizontally and with depth. We provide a basin-scale assessment of the magnitude of pollution by these polymers in the upper 200 m and relate these data to the previously calculated plastic inputs to the ocean over the past 65 years.
Results
Field observations
To quantify and characterise the horizontal and vertical abundance of PE, PP and PS, at each station of the transect we collected suspended marine particles including plastics using in situ stand-alone pumps (SAPs; Challenger Oceanic Ltd.)21,22 deployed simultaneously at three discrete depths (Fig. 1b and Supplementary Table 1; ‘Methods’). The shallowest sampling depth was always at 10 m below the surface to obtain concentrations of microplastics representative of the upper water column (Fig. 1b). We collected microplastics at two depths below the base of mixed layer to measure their dispersal into the ocean interior. The mixed layer depth (MLD) was determined from the conductivity–temperature–depth profiles collected prior to each deployment of the pumps (refs. 23,24) and employing a fixed temperature-based criterion (ΔT = 0.8 °C for stations 01–19 and ΔT = 0.3 °C for stations 23, 27 and 30; Fig. 1b; see ref. 25). On our latitudinal transect, the MLD was between 28 and 140 m. The intermediate sampling depth was selected to be at ~10–30 m below the MLD (Fig. 1b; Supplementary Table 1). The deepest (mesopelagic) layer of particle collection was 100 m below this intermediate sampling horizon, a depth well into the interior of the ocean (Fig. 1b; Supplementary Table 1) and isolated from the ocean surface for decades26.
All steps involving sample collection, processing and analysis were performed in the air-controlled environment and using clean, pre-combusted and where possible non-plastic laboratory-ware (‘Methods’). Particle collection with SAPs offered significant advantages with respect to the volumes of seawater filtered (507–1534 L per SAP; Supplementary Data 1) and prevention of air-borne contamination (‘Methods’). No PE, PP and PS microplastics were detected in all procedural blanks (Supplementary Figs. 1 and 2) indicating contamination-free sampling and analysis (also see Supplementary Methods). Following the removal of particulate organic material with KOH27,28, microplastics were pre-concentrated on a stainless-steel mesh with 25 µm aperture to be detected and characterised (polymer type and size) using Fourier-Transform infrared (FTIR) imaging at 25 µm resolution (‘Methods’).
We report the concentrations of polymer-specific microplastics as particle number per unit volume (particles m−3) for a comparison with previous studies. Imaging IR provides two-dimensional (2D) properties (length, width, area) of individual particles, which, along with the respective particle count data, was used to estimate polymer-specific mass concentrations (µg m−3: see ‘Methods’, ref. 24 and Supplementary Data 1) and subsequently their respective loads in the ocean (‘Methods’). We calculated particulate mass using the same procedure and assumptions of particle shape, thickness and density as in previous studies10,29,30,31,32 but report the lowest values to provide the most conservative estimates of mass concentrations (detailed in Supplementary Methods and Supplementary Fig. 3). Mass of individual microplastics <300 µm have not been measured directly in bulk marine particle samples. We present empirical information about the size and mass of polymer-specific plastic penetrating deeper into the ocean interior, crucial for understanding and predicting the global inventory of marine plastic debris and their sources.
Abundance and distribution in the Atlantic Ocean
PE, PP and PS microplastics were found at all stations in number and mass concentrations that varied by several orders of magnitude horizontally and with depth (Fig. 2). Overall, PE was the most abundant and pervasive polymer group with significantly higher number and mass concentrations (mean ± s.d., 1602 ± 1551 particles m−3 and 389 ± 377 µg m−3) compared to PP (490 ± 822 particles m−3 and 262 ± 568 µg m−3) and PS (180 ± 439 particles m−3 and 58 ± 241 µg m−3) (for all, Mann–Whitney U test: p < 0.001, α = 0.01). PE microplastics were identified in all samples except for the intermediate depth layer of the southernmost station (53°S). Note that no PP or PS microplastics were found at this sampling location, although other types of polymers such as polyamide and cellophane were present (Supplementary Data 2), from which we conclude that the absence of PP and PS was not a consequence of faulty sampling. The presence of PP and especially of PS below the MLD was patchy. Only 67% of the samples from the intermediate depth layer contained PP while PS microplastics were encountered in 60% of the surface samples and in <50% of the deeper ones.
Source : Nature Communications